
How-tos: Studio Pro Troubleshooting
Debug
Introduction
Debugging is a stage of algorithm development in which errors can be detected, localized, and eliminated. Studio Pro has its own debugger that allows you to monitor algorithm execution, stop and restart it.
How to debug an algorithm in Studio Pro
Debugging in Studio Pro should be used when you want to find out exactly at what stage of the algorithm's operation errors occur. After the error is localized, you can understand the reasons for it and eliminate them. Below we look through the capabilities of the debugging tool and show some examples.
Concepts
Breakpoint
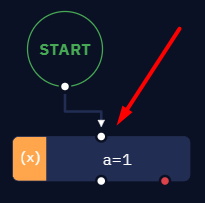
Breakpoint is the main tool for working with the debugging tool. If you set a breakpoint on some activity, all previous activities will be executed and the execution of the algorithm will stop before the designated breakpoint. Thus, you will be able to capture the current state of the system and analyze the functionality of the algorithm. To set a breakpoint, put the cursor on the desired input port of the desired activity and click the left mouse button.
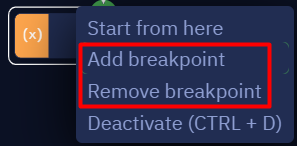
You can also add or remove a breakpoint by right-clicking on the desired activity on the canvas.
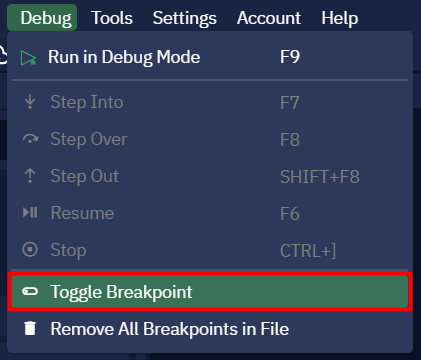
Another way to add a breakpoint is to use the "Toggle breakpoint" option in the "Debug" tab. Before that, you need to select the activity block where you want to add a breakpoint.
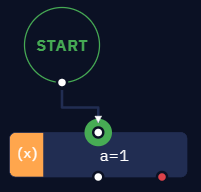
After that the port will be highlighted with a green circle, indicating a breakpoint. You can remove a breakpoint by reverse actions: left-click on the port where the breakpoint is set, right-click on the action block and select "Remove breakpoint" option or use "Switch Breakpoint" option. Use the "Remove all breakpoints in file" option in the "Debug" tab to remove all breakpoints from the algorithm.
Debugging process
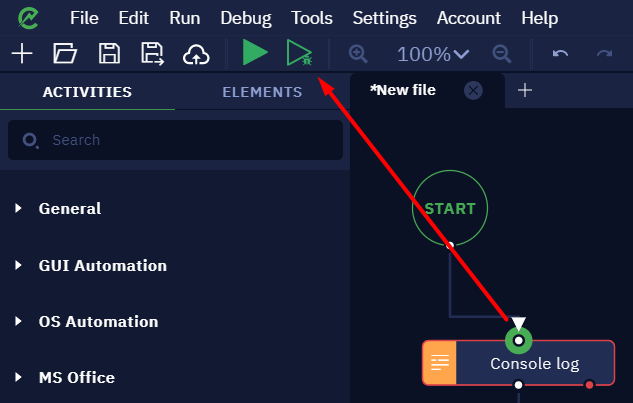
After setting at least one breakpoint, the "Run debug mode" action appears on the top toolbar. Having started in debug mode, the bot will perform all activities up to the breakpoint.
After that, the debugging tools will appear in the top toolbar.
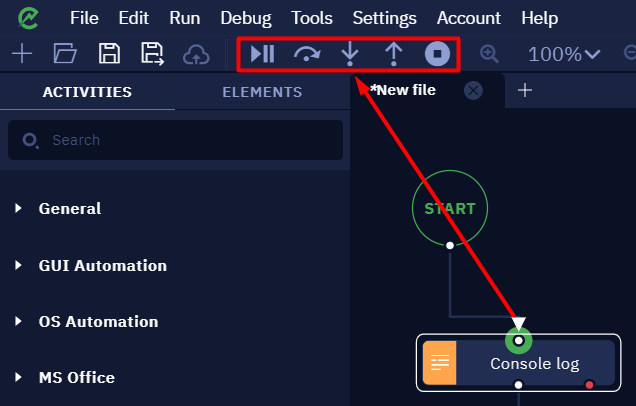
These symbols (from left to right) denote:
- Resume — continue executing the algorithm in debug mode until the next breakpoint. If there are no more breakpoints, the algorithm will be executed to the end and the bot in debug mode will stop.
- Step over — execute a step over.
- Step into — execute a step into.
- Step out — execute a step out.
- Stop — stop the execution of the algorithm in debug mode. In this case no further actions will be performed.
Debug mode can also be run directly during the execution of the algorithm. This is useful when executing a large algorithm - you don't have to run the whole algorithm over again in debug mode, you can just set a breakpoint at some action (of course, if the bot hasn't started executing it yet). That way, when the breakpoint is reached, the execution of the algorithm will stop and the debug mode will start.
The "Resume" and "Stop" actions are used to resume or stop the debugging mode generally. The "Step over", "Step into", and "Step out" actions apply directly to activity blocks. They apply to all activities including the Subprogram activity. Let's take a closer look at them:
Step into
If you use a "Step into" with any activity other than the "Subprogram", the bot will simply execute that activity. In the case of a subprogram, a step into will open it and the algorithm will stop, after which you can continue debugging the subprogram activity with all the available debugging tools.
Step over
The "Step over" as well as the "Step into" will simply execute any activity except the "Subprogram". In the case of a subprogram, the "Step over" will execute it completely, without stopping at each activity and without opening the subprogram.
Step out
The "Step out" performs an activity and ends the execution of the algorithm in debug mode in the current subprogram. Thus, if you use the "Step out" inside a subprogram that is not called anywhere else, the bot will stop after using this step. If, however, this activity is not performed in a main subprogram, you will exit the child subprogram after hitting "Step out" and be able to continue working in debug mode in the main subprogram.
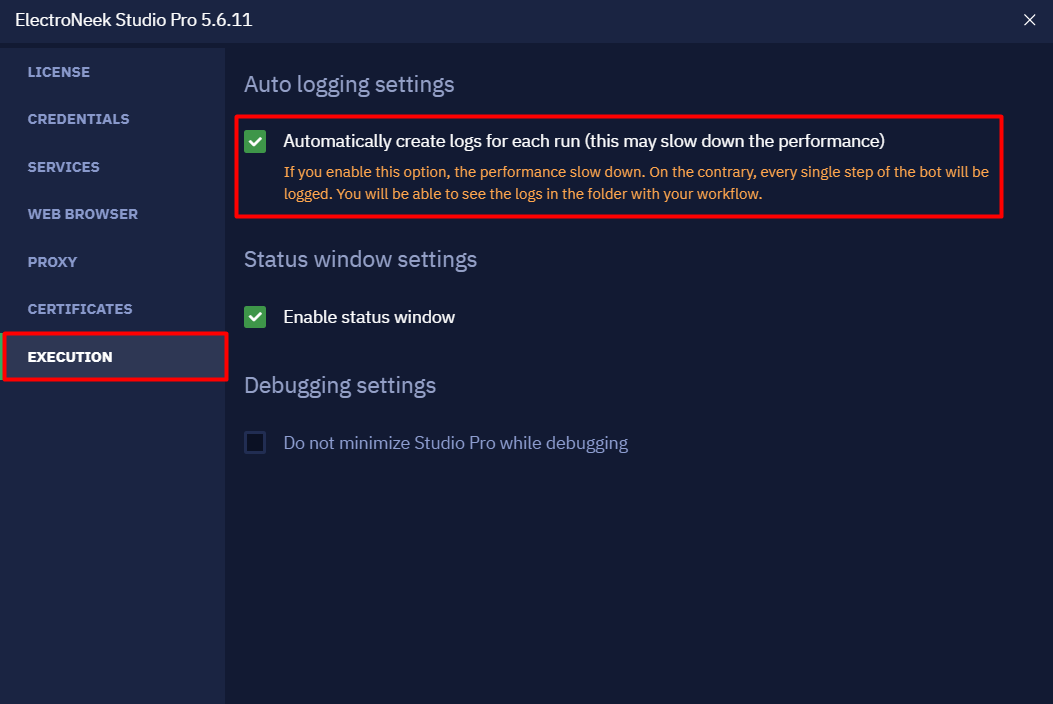
By default, Studio Pro will be minimized every time you perform some activity in debug mode, which is necessary to test how the bot works with interfaces (websites or applications). If you are debugging an algorithm that does not require working with interfaces, you can disable the Studio Pro minimization to reduce the algorithm's running time. This can be done in the menu "Settings" → "Execution" → "Debugging settings" → "Do not minimize Studio Pro while debugging".
Debugging example
Let's take a look at an example of debugging the algorithm. Note that in the example below we show only the principle of debugging, there are no errors in this algorithm. In reality, all sorts of errors can occur, and the processing of the algorithm will always have individual aspects.
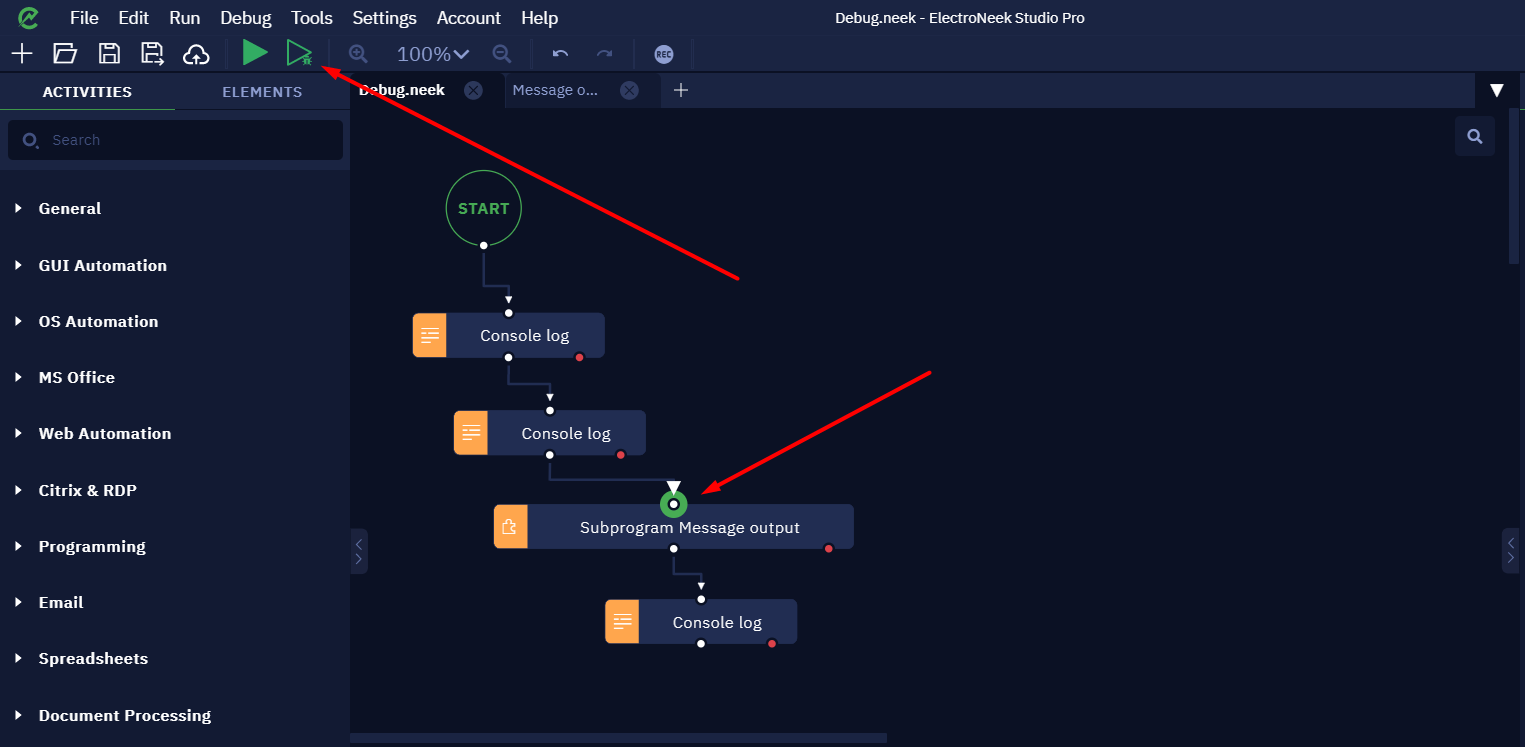
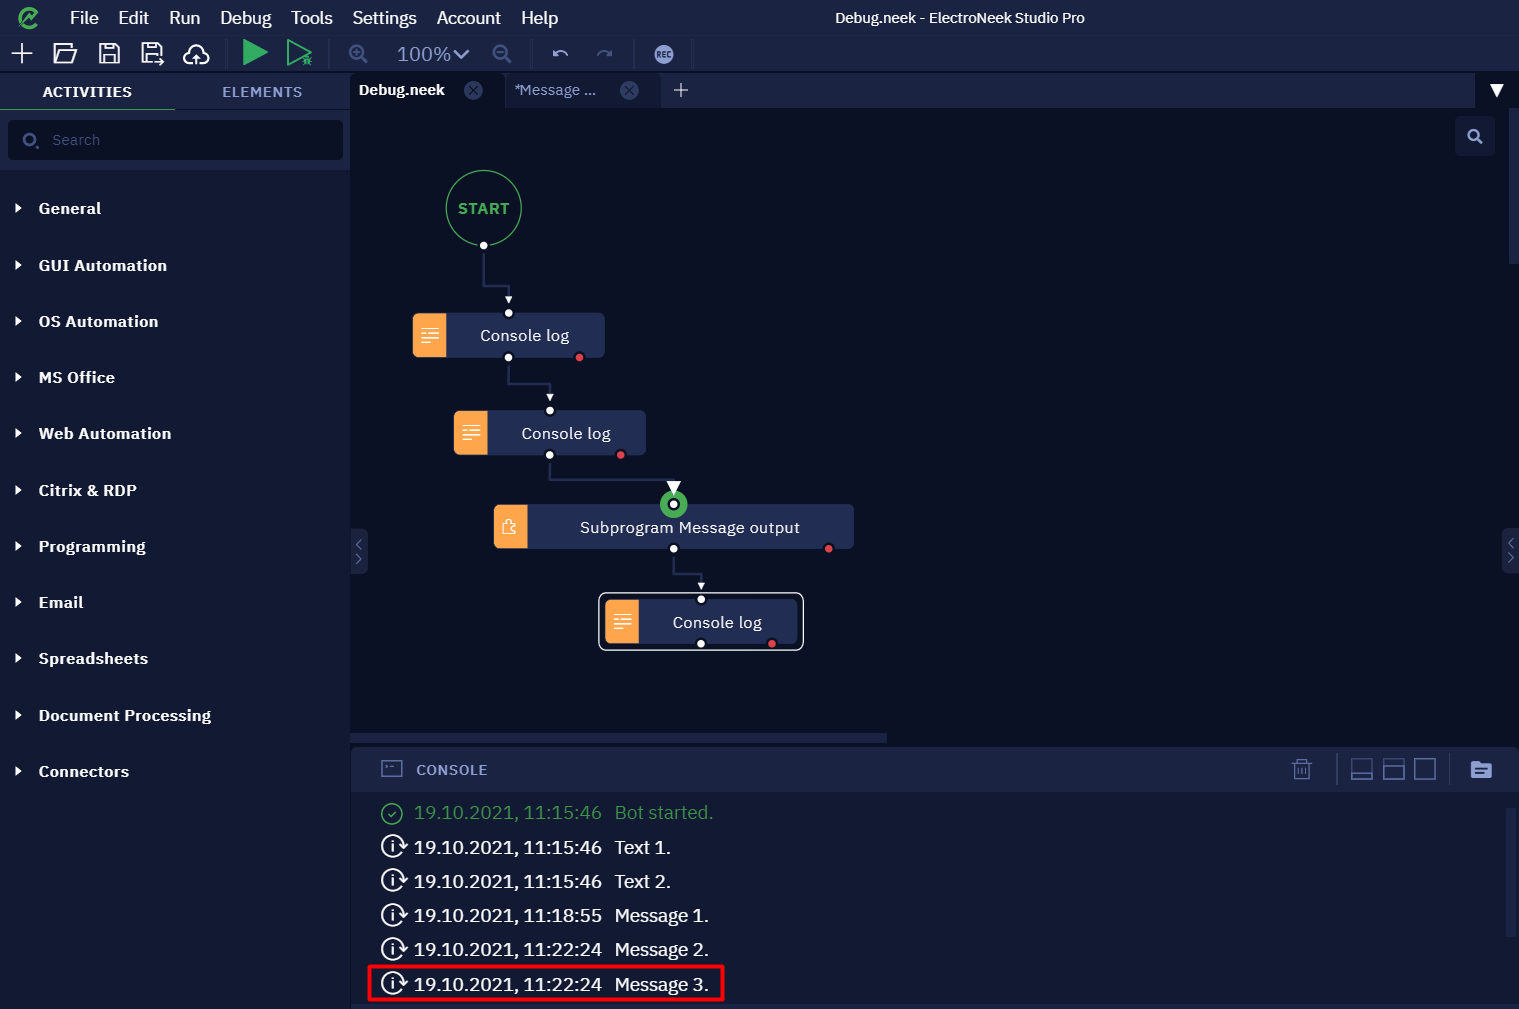
For a simple demonstration, let's take the algorithm that outputs messages to the Studio Pro console.
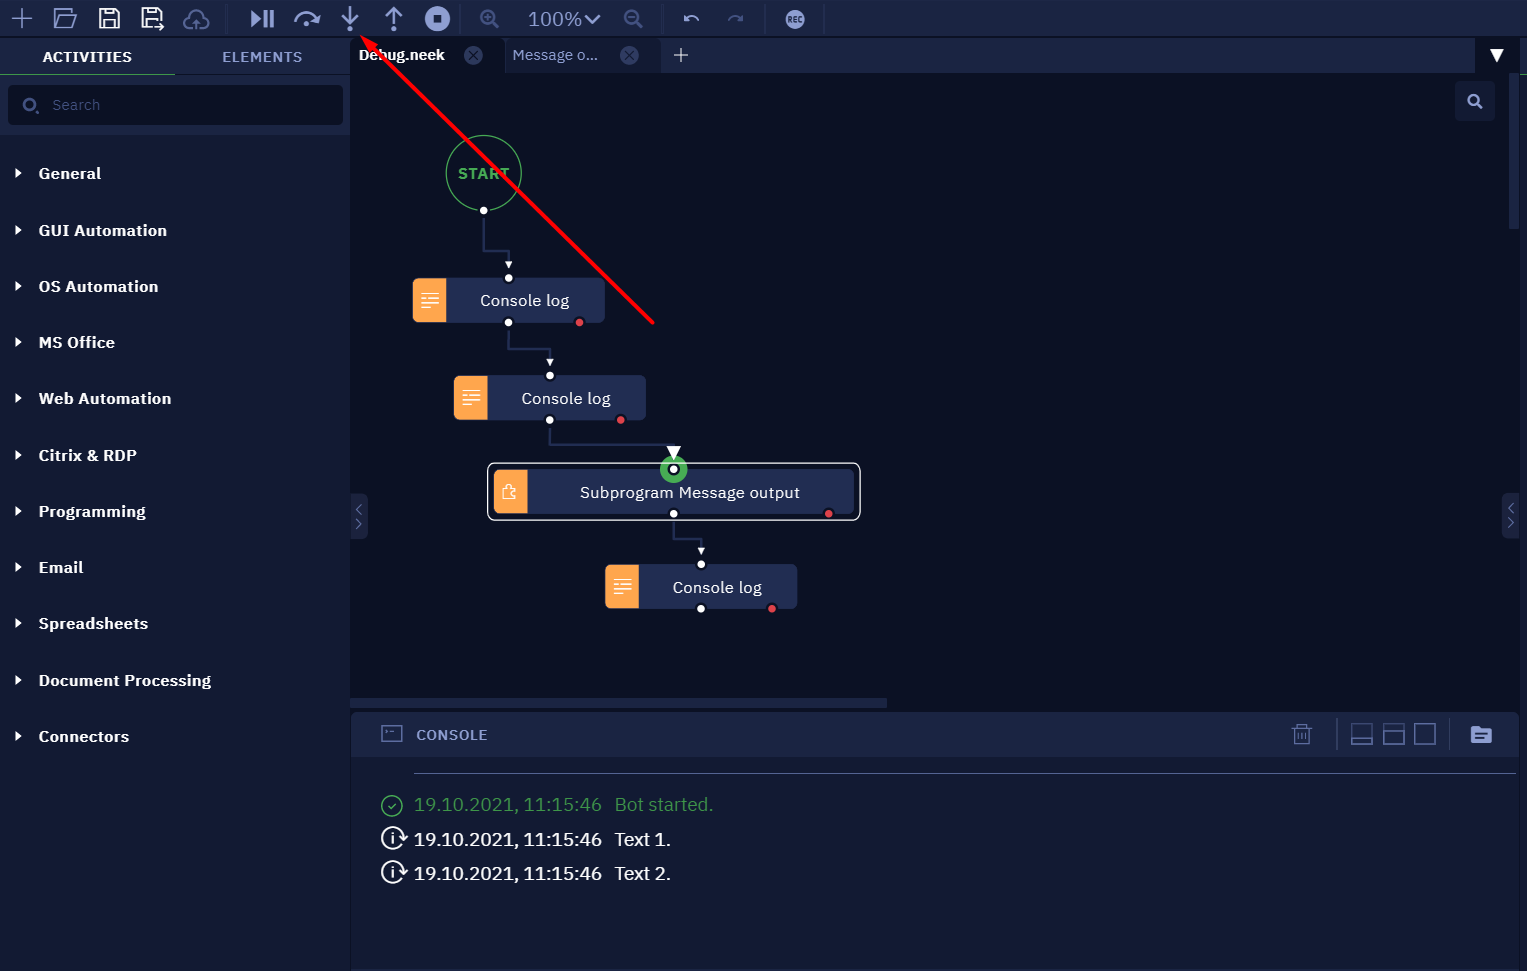
Let's put a breakpoint on the "Message output subprogram" activity and run the algorithm in debug mode.
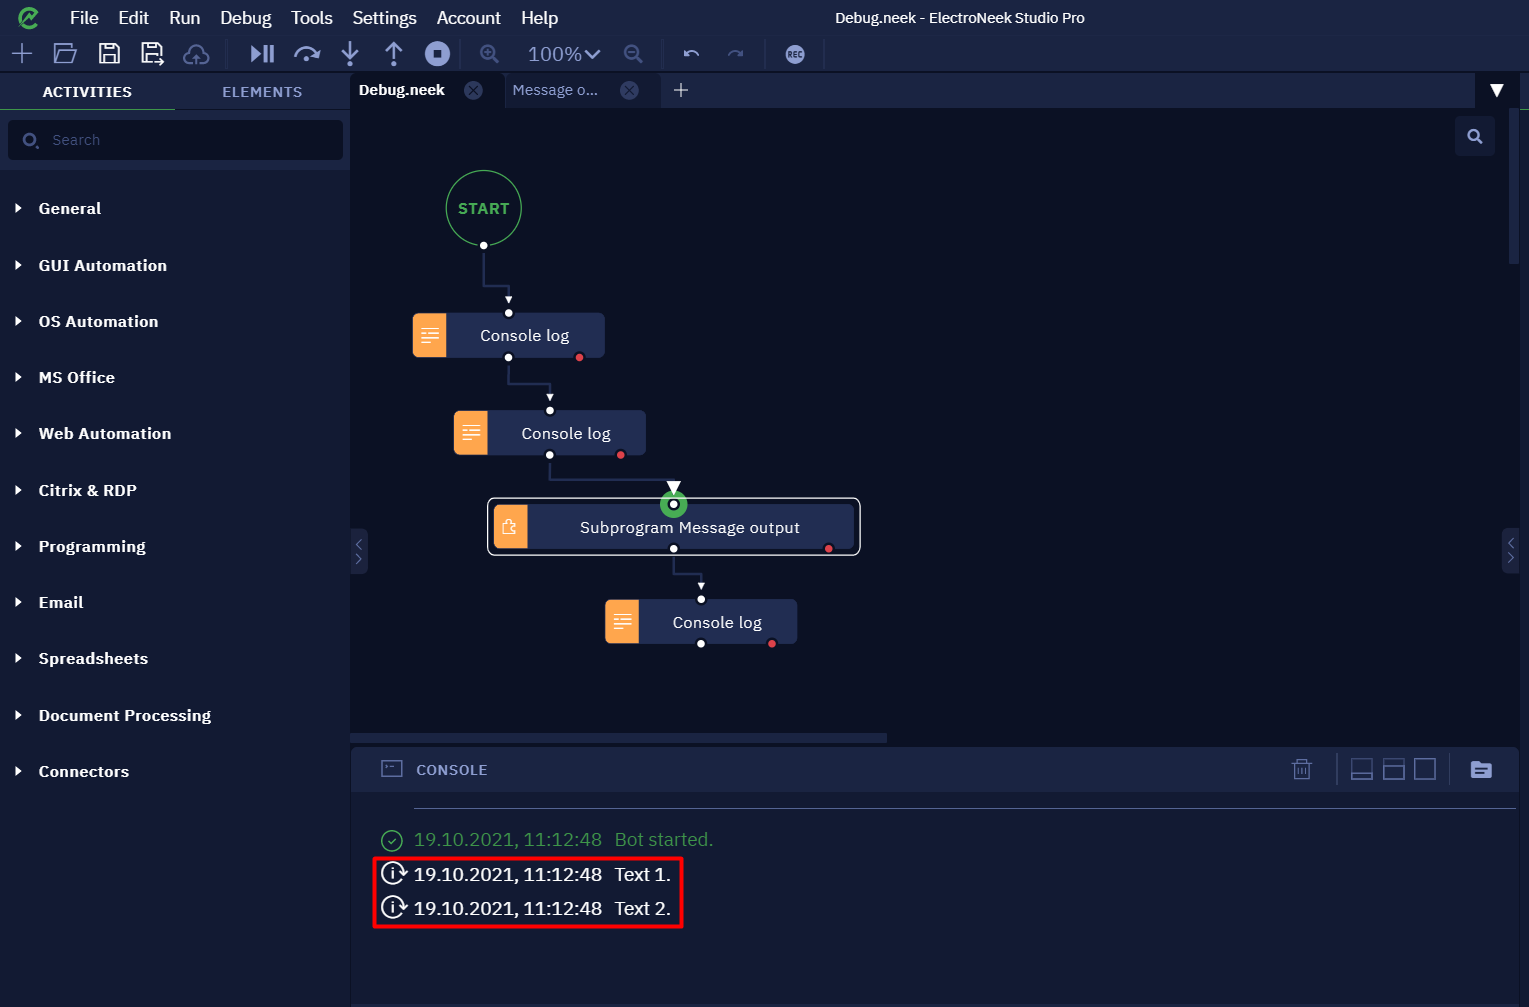
There will be two activities before the breakpoint - we will see two logs in the console.
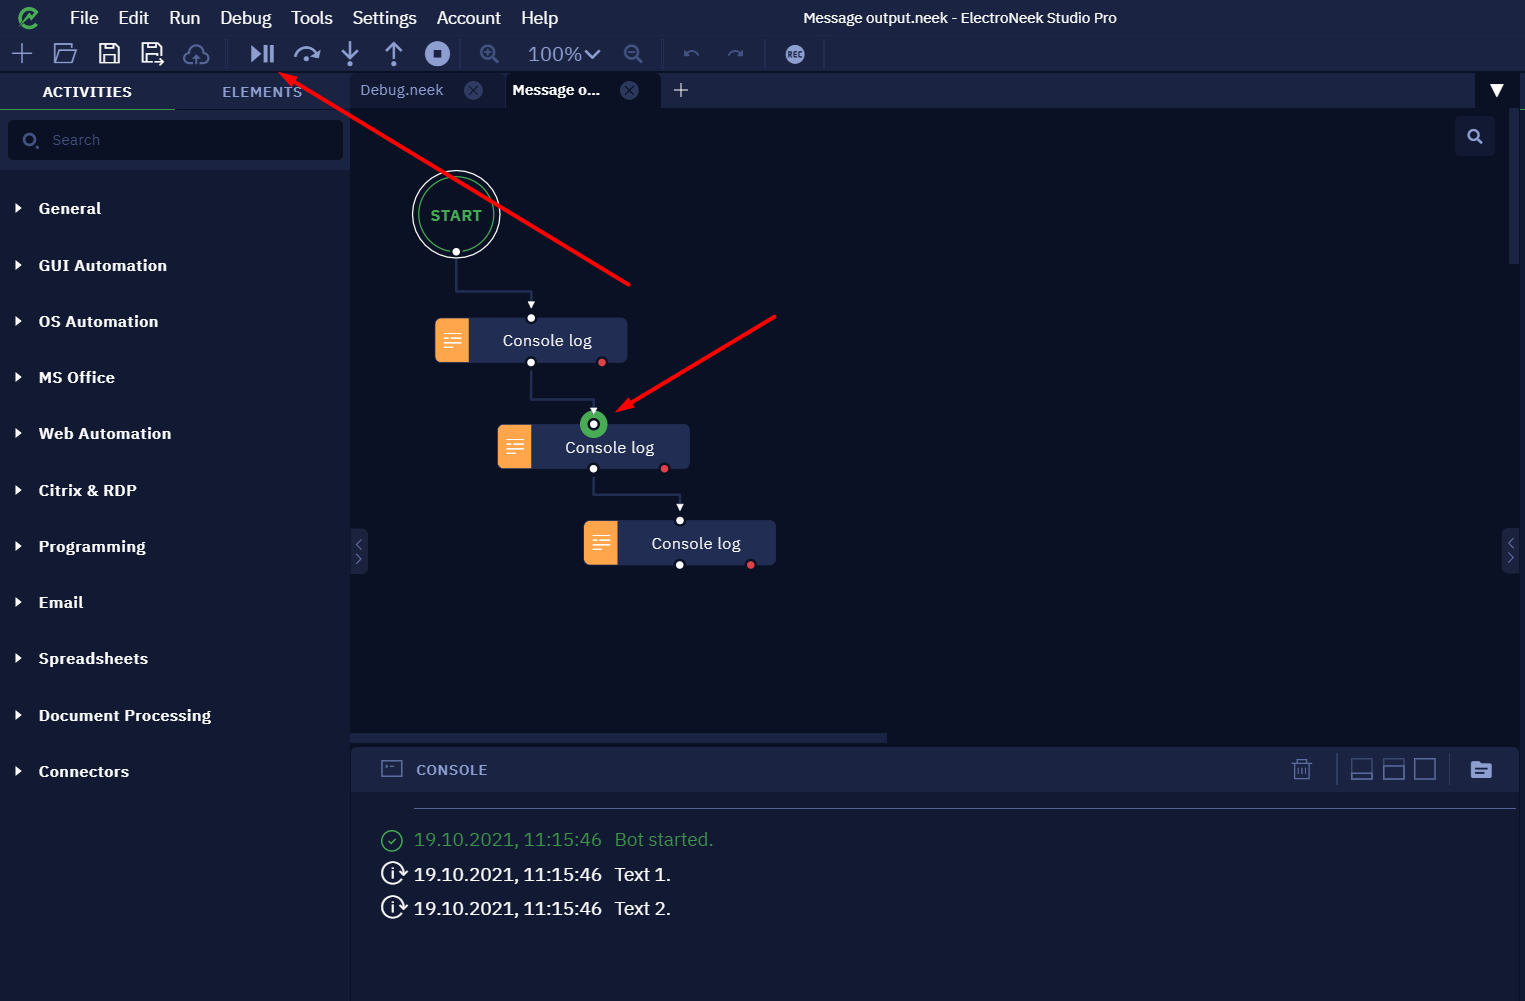
Let's assume that at this stage we are satisfied with everything. Next, we want to continue with the actions of the "Subprogram". Let's leave the breakpoint at the same place and execute the "Step into".
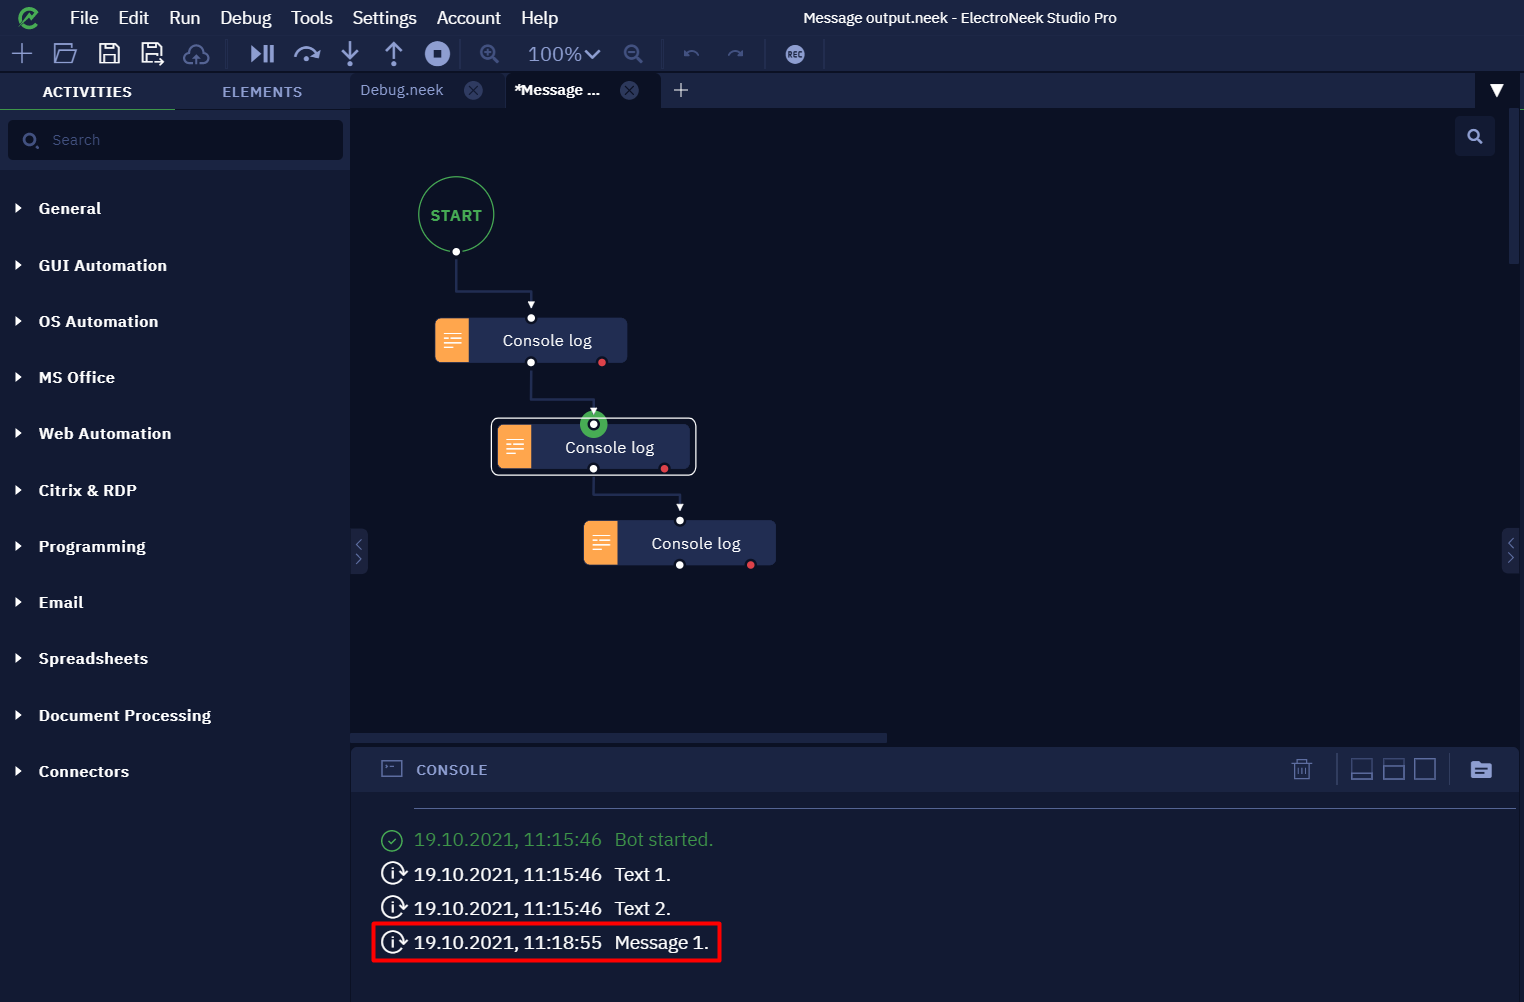
This will get us inside the subprogram, but the activities in it will not be executed. Let's put a breakpoint on the second activity and press "Resume".
This will execute the activity up to the breakpoint.
Next, perform the "Step out" - to return to the main subprogram.
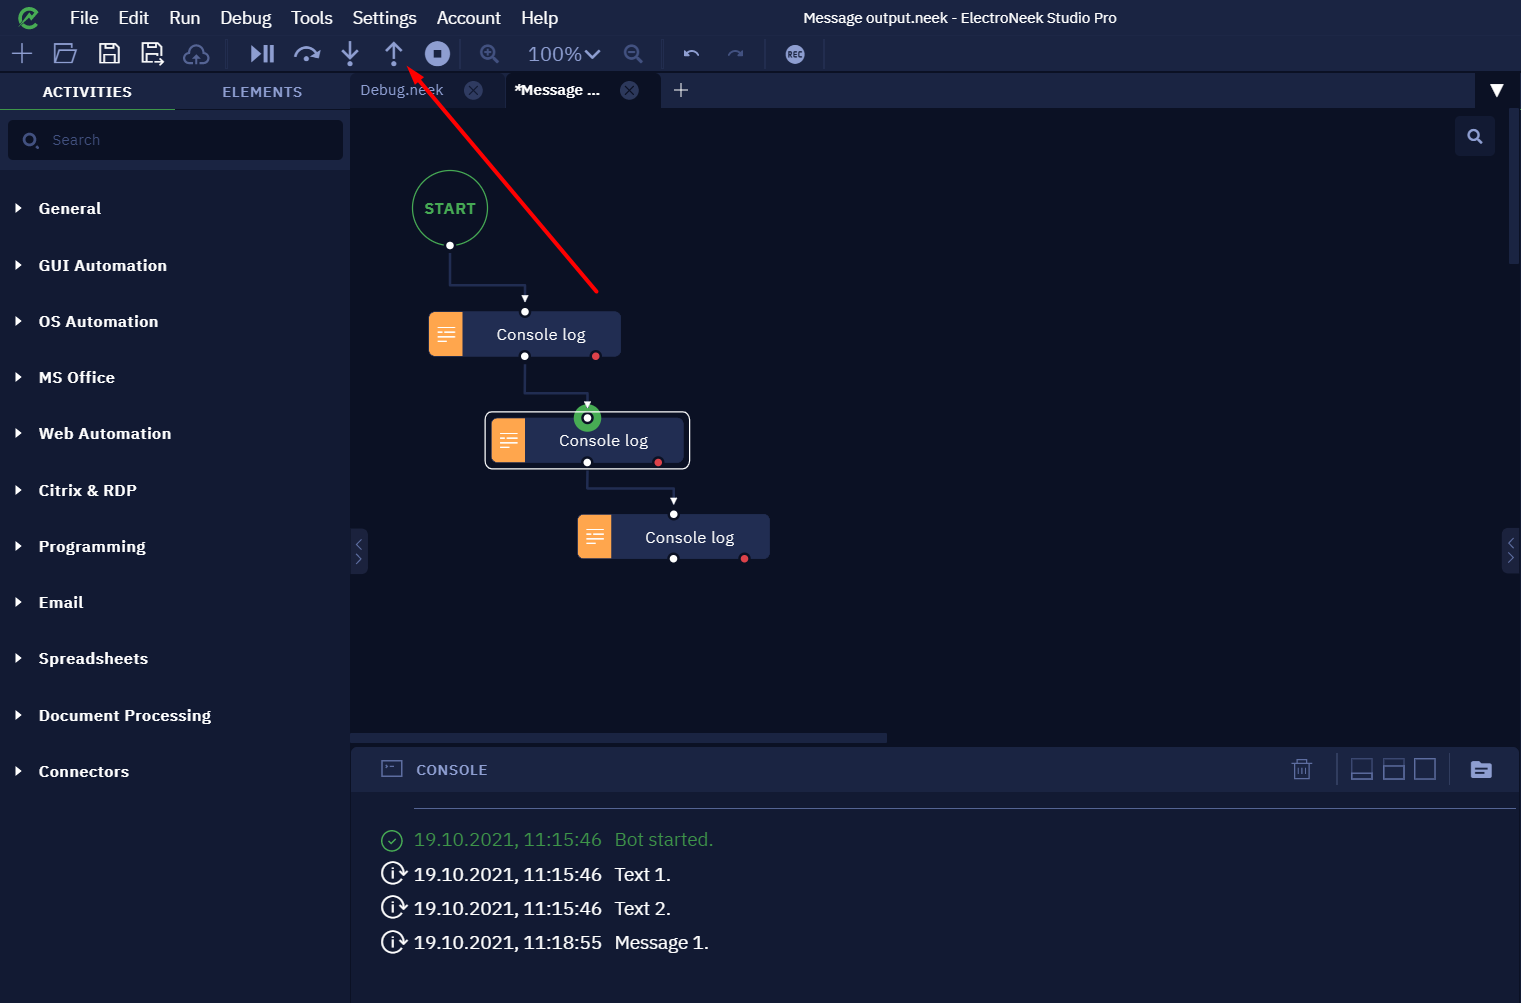
The last subprogram activity will be executed, and we will return to the main subprogram. Note that the last activity in the algorithm has not yet been executed, we are still in debug mode.
Now you can press "Resume" again to finish the execution of the algorithm with the last activity after the "Subprogram".
Note
- If your algorithm contains the Assign value to variable activity, the value of the variable will be set only after the activity is executed in the debug mode.
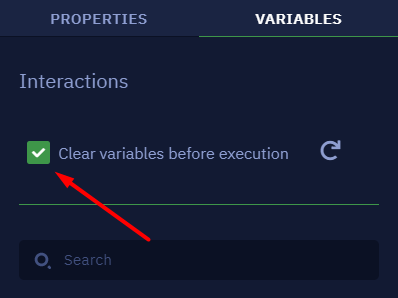
- The variables will be saved after creation. If you need the variables to be set anew each time you repeat an action during debugging, use the "Clear variables before execution" option.
Exceptions handling
Introduction
When developing an algorithm, the developer often has to consider the program's behavior in different scenarios and think through the steps for handling possible errors in the bot's operation. For example, if the bot is supposed to work with files on a computer, a situation can arise when the necessary file or folder is missing (has been moved or deleted). This scenario (depending on the business process, of course) can usually be foreseen and handled quite easily, for example, by adding an activity to check the presence of a file before the activity that works directly with that file.
However, there may be exceptional situations that cannot always be foreseen. For example, when working with the interface of the application or browser, it may happen that some element (a button or a picture) will not load in time or will not appear at all. And when the algorithm reaches the step of working with this activity, an exception will occur, because the bot will not be able to find the element in the given time. There are several ways to handle such exceptions, we will describe them in more detail below.
Exceptions handling mechanism
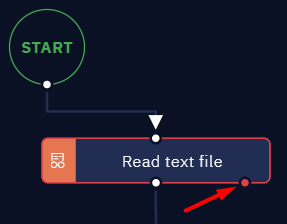
Each activity block has an "Error" port, or "red port" as it is called. This is the port to which you can bind a set of activities to be performed if an error occurs during the main specified activity step.
Let's take a simple example of error handling in the execution of an algorithm.
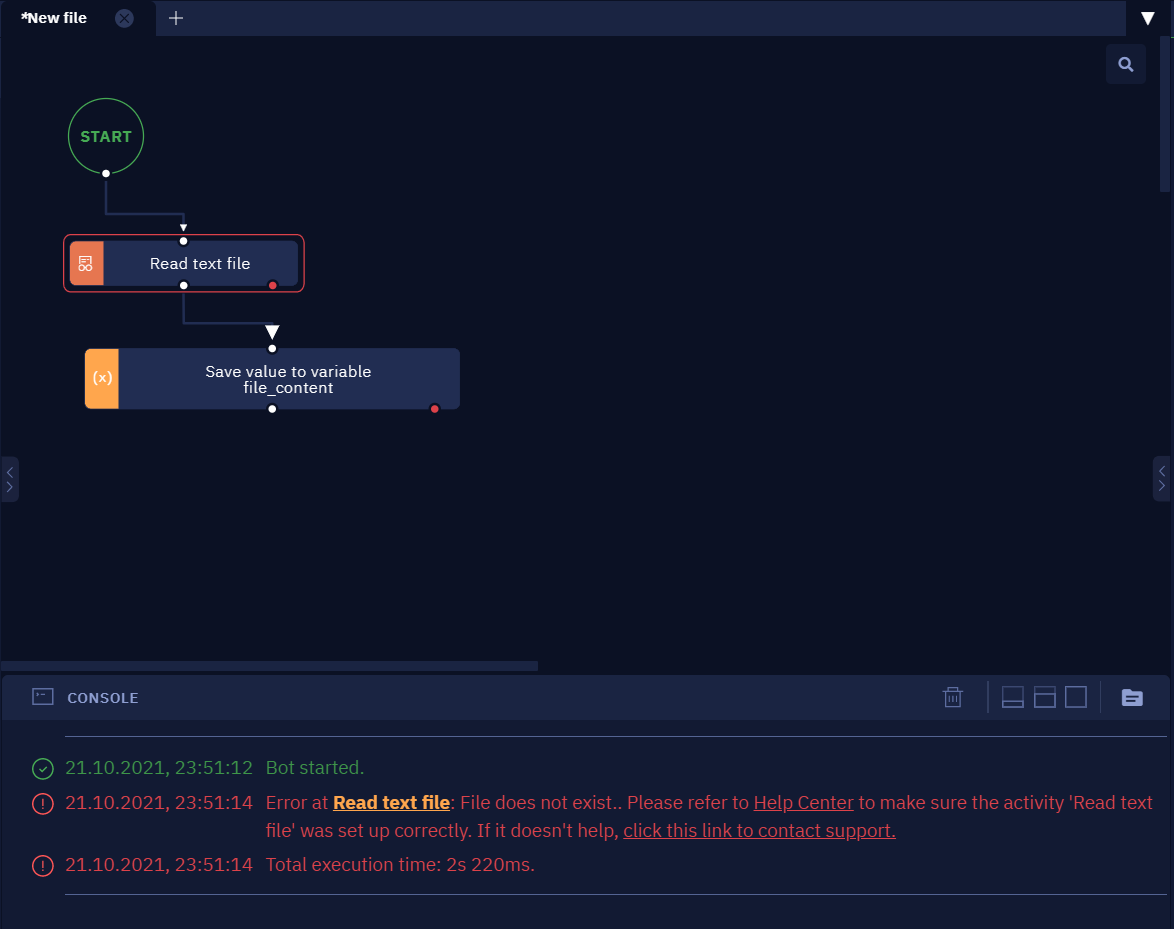
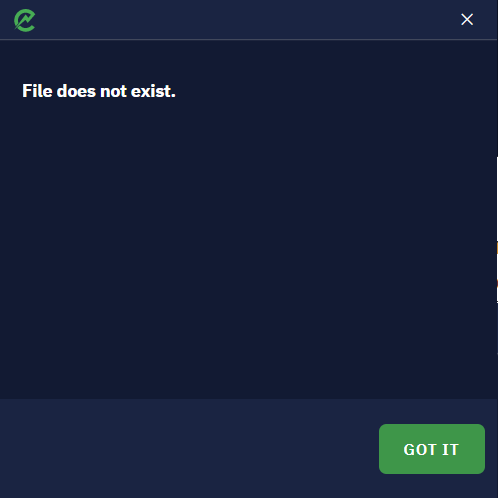
Suppose that our bot has to read text from some file. To do this, we use the Read text file activity, but deliberately move the file itself before launching the bot, so that the bot won't be able to find it. For some time the bot will try to find the required file, but will eventually stop and an error message will appear in the console:
Now let's look at the exception handling process itself. Let's design the algorithm so that the bot displays the cause of the error in the notification window for the user.
-
Specify a path to file in the Read text file activity. The path should look like this:
C:\\Users\{USERNAME}\\Desktop\\Sample file.txt -
Move this file to some folder so that the path to the file changes, but we won't change the "Path" parameter in the activity parameters.
-
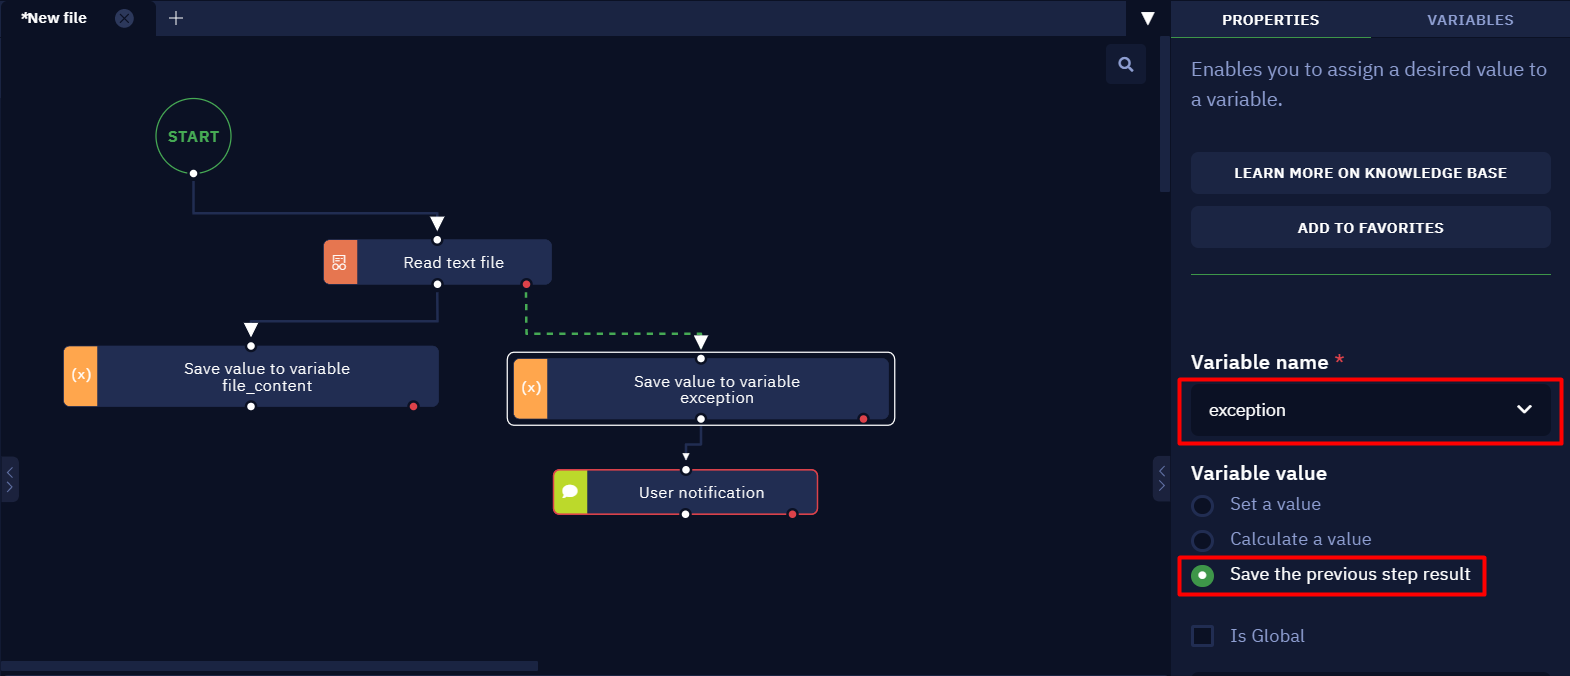
Add the Assign value to variable activity via the red port. You can set any name for the variable, for example "exception". In the "Variable value" parameter, pick the "Save the previous step result" option.
- The next acivity in the workflow will be the User notification activity. Pick the "Save the previous step result" option in the "Description message" parameter. You can specify any value as a "Button name" parameter.
Run the algorithm. The bot will try to find the file, but when it fails, there will appear a message showing that there is no such file in the given path.
In reality, such a scenario can very easily be foreseen and handled (by checking the presence of the file manually). In this example, we want to demonstrate an approach that could be used in such a scenario if the manual check cannot be performed before launching the bot, so you can see on a simple example the principle of exception handling.
Useful tips for exceptions handling
The following tips and tricks are recommended when processing exceptions:
- Try to anticipate possible bot behavior and, where it makes sense, handle each scenario explicitly.
- When using the "Error" port, it is often useful to save an error message and display it in the log or in a message to the user. For the business user, you can provide a clearer error message.
- In some situations, it makes sense to allocate the part of the algorithm into a subprogram, within which not to handle exceptions. It is better to use the "Error" port from the subprogram block to handle exceptions. See "Handling exceptions across subprograms" for more details.
- A good practice in some cases is to catch an exception and return the algorithm to its starting point for another pass. For example, if the algorithm involves transferring data from a set of documents into a program, a good solution when an exception occurs at any iteration is to close the program (or force termination) and return to the initial state of the algorithm to re-process that document or move on to the next.
- If your algorithm interacts with the interface of a website or some application, it would be useful to add the Take a screenshot activity via the red port. Thus, when an exception occurs, you can not only see the error message in the console, but also a screenshot of the moment the error occurred, which will allow to understand the causes and handle the exception in more detail.
Handling exceptions across subprograms
Introduction
When your projects are more complex, and you wish to use Subprograms to handle different tasks, it is important to have visibility over exceptions and handle them, even if they occur in different flows.
When using Subprograms inside of your projects, you are using a version of the "Main/Sub" approach to development -- that is, your projects' starting point turns into your "Main" flow (even if you don't give it that name), and it relies on multiple "Sub" flows to perform individual tasks. The job of your Main flow is to connect all Sub flows together into a cohesive end-to-end workflow.
Working with subprograms
As you may know, in all activity blocks the red port allows your flow to react to the block's exceptions without stopping the execution, and by adding an Assign value to variable activity (using the "Save the previous step result" option), you can even capture the error details, including an error message.
This same approach works with Subprograms too. When you call a Subprogram from your Main flow, you can connect the Subprogram block's red port to other steps, including an Assign value to variable step, like you would with a regular block. When doing this, any unhandled exception (that is, not connected to a red port) that occurs inside the Subprogram will, instead of stopping the bot's execution, skip the rest of the Subprogram's steps and return to the Main flow, then proceed through the path connected to the Subprogram block's red port.
Keep in mind that, if your Subprogram does not have its red port connected, and an exception occurs inside it, then the whole bot's execution will indeed stop, like with any other step.
With this in mind, some common practices for exception handling in Main/Sub development are:
- Use Global variables to hold important exception-handling information, such as the error message, the location of error logs, and possibly even a variable that tells whether or not an error has occurred. This type of variable can only have two values: true or false. Other ways of communicating the same results can be with numbers (1 or 2), or with text ("Yes" or "No", "On" or "Off", etc.) This is typically called a Boolean variable, or "flag" (because you "raise" it / convert it to true when a certain even occurs, like a flag is raised in football when a foul occurs.)
- For lethal exceptions (those that don't allow execution to continue), use common a single exception handling and reporting mechanism across the entire project. For example, create a Subprogram called "report_errors.neek" that always writes the error message to the Console Log, takes a screenshot, and sends an email to administrators including that error message and screenshot. This report would work regardless of where in the project the error occurs.
- Implement a retry logic, but make sure to limit it to avoid infinite loops. A retry logic refers to instructions that tell the flow to repeat a step that failed previously. In some cases, exceptions might "heal themselves" by simply trying the same step again, or by giving a system enough time to load the necessary page or elements. But by applying a limit (for example, a counter of attempts and a number of max attempts, and an if condition to compare these values before retrying), you prevent the flow from running endlessly in cases where the exception cannot be self-healed.
While these are common approaches, each team or developer is free to try
Example
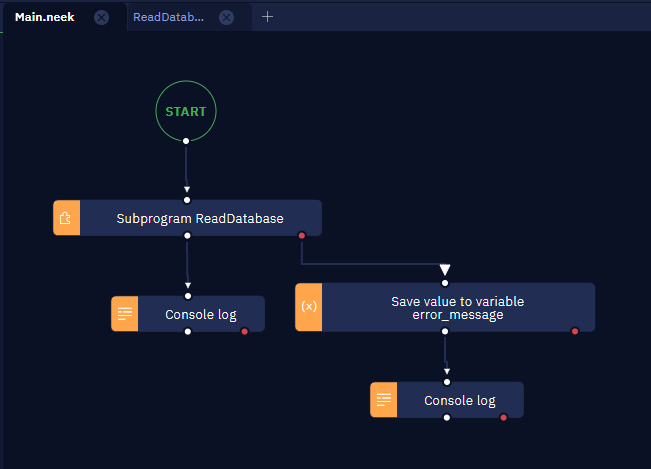
In the following example, we have a Project with a Main flow ("Main.neek") and a Subprogram ("ReadDatabase.neek").
The Main flow looks like this:
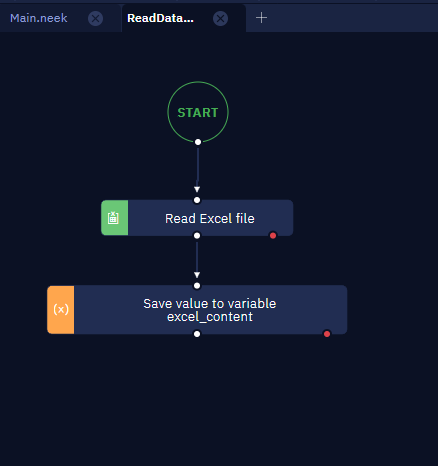
And the Subprogram, "ReadDatabase", looks like this:
Because the Subprogram has its red port in use, that means that any exception that occurs inside it will return execution to the Main flow. The next step to execute after that will save the error details to the "error_message" variable, and the step after that will write to the Console Log.
So if the Read Excel file block fails inside the Subprogram (for example, because the file cannot be found or is inaccessible for other reasons), the "Save value to variable excel_content" step will not be executed; instead, execution will return to "Main.neek" and proceed through the red port's path.
Logging
Introduction
Studio Pro features different types of logging. Logs can reflect the system state and provide the information, necessary for debugging or analyzing the execution of workflows.
Studio Pro records logs in multiple places depending on whether the workflow is saved to a .neek file or not.
- Unsaved
.neekfiles save their logs inC:\Users\{username}\electroNeek\logs. - Saved
.neekfiles save their logs in{neek_file_location}\logs\{neek_file_name}.
For example: if your.neekfile is located atC:\Users\Administrator\Desktop\Test\Test.neekyour log folders would be atC:\Users\Administrator\Desktop\Test\logs\Test
The workflow logs are accessible through Studio Pro. It will open the correct location both if the workflow is saved or not.
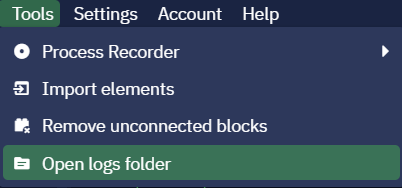
These are the folders that contain Studio Pro logs:
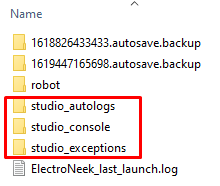
Types of Logs
Studio Pro maintains logs for the console (within Studio Pro), exceptions from running Studio Pro, autologs (when enabled) of your system’s information, Studio Pro configuration, and every step of the execution of bots.
Autologs
The autolog file is the main and the most important source of information that you can receive and send to the Support Team in order to solve a certain issue. It contains all the information in regard to your machine specifications, Studio Pro’s components versions, and every step of the workflow as well. Thus, it is the most detailed log file created automatically.
There is a certain structure of the file:
- Environment information (OS version, components versions, etc.).
- Information describing every step of the bot. The start and end steps of the bot execution are also recorded.
The information is displayed as: “Time of log-message - JSON”, for example:
16:26:46.328 {"programs":[{"program":"InternetExplorer","version":"11.789.19041.0"},

{"program":"Chrome","version":"91.0.4472.124"},

{"program":"1C"},{"program":"ElectroNeek Studio","version":"5.6.11.0"},

{"program":"ElectroNeek Robot","version":"5.6.11.0"},

{"program":"msedgedriver.exe","version":"79.0.313.0"}],"windows":{"caption":" Windows 10 Pro","version":"10.0.19042","csd_version":0,"os_architecture":"64-bit"},

"cpu":{"name":"AMD Ryzen 7 3700U with Radeon Vega Mobile Gfx","number_of_cores":4,"number_of_logical_processors":0,"number_of_logicalprocessors":8},

17:03:21.706 {"activity_name":"START","file":"C:\\Users\\owlyo\\Desktop\\Bot Text\\Text bot.neek
","script_id":"b8c90d98-e2a5-49c2-9ddd-28d77172bb59","memory_usage":117484,"version":{"launched_by":"5.6.11","created_in":"5.6.11","updated_in":"5.6.11"},"start_time_iso":"2021-06-29T12:03:21.692Z","activity_group":"General","end_time_iso":"2021-06-29T12:03:21.693Z","duration_ms":1,"status":"success","error_message":null,"output_result":null,"executed_branch":"next","parameters":[{"name":"version","value":"4.0.0"}
Studio Pro Autologs
To enable that type of logging, navigate to “Settings” → “Execution” and enable the “Automatically create logs for each run” option.
The autolog file will be saved in the same directory as the workflow. For example: C:\Users\Username\Desktop\Project 1\logs\Project 1\studio_autologs
As of the 8.5 version, autologs contain the following information:
Environment information:
- Standalone or Dependent
- Application version
- Google Chrome/MS Edge version
- Webdriver version
- Extension's version
- User information:
- Region
- uID
- License
- Permissions
Events:
- Process flags
- Login - with a link to a .neek-file link
- Logoff
- Start workflow
- End workflow
- Messages from the Studio Pro console
Network events:
- Failed requests with URL, parameters, message
- Connection to sockets (with URL)
- Socket connection failures (with URL)
Bot Runner Autologs
The same can be applied to the ElectroNeek Bot Runner application. Navigate to this article to know more about logging in Bot Runner.
Console Logs
All of the information that is displayed in the Studio Pro console while working with the product and while the workflow is running is logged in a separate file. This can be convenient in situations where detailed logging of each action is not required, while the console displays explanatory texts for the user (for example, values of key variables), which allows you to immediately see this in the console log file, instead of searching for this information in the detailed autologs.
The structure of console logs looks like this:
[DATE and TIME] : [MESSAGE TYPE]: MESSAGE

Here is an example:

[2021-06-28T10:00:12.199Z] : [info]: ---------------------------------------------

[2021-06-28T10:00:26.728Z] : [success]: Bot started.

[2021-06-28T10:00:26.730Z] : [info]: Robot start

[2021-06-28T10:00:30.160Z] : [success]: Bot finished successfully, total execution time: 3s 427ms.
Exception Logs
Exception logs log the exceptions encountered by Studio when running. These logs typically refer to the environment issues or issues with Studio that do not necessarily coincide with the running of a workflow.
The structure of the Exception Log file displays the name of an error and the place where it occurred. For example:
Unhandled Rejection at Promise

      getaddrinfo ENOTFOUND account.electroneek.co

Error: getaddrinfo ENOTFOUND account.electroneek.com

    at PortalBackendApi.transformError (C:\Program Files\ElectroNeek\Robot\resources\app.asar\dist\main.js:1:701496)

    at C:\Program Files\ElectroNeek\Robot\resources\app.asar\dist\main.js:1:701043

    at runMicrotasks (<anonymous>)

    at processTicksAndRejections (internal/process/task_queues.js:97:5)
How to interact with terminals
What is a terminal?
A computer terminal is an electronic or electromechanical hardware device that can be used for entering data into, and transcribing data from, a computer or a computing system. A terminal emulator is a computer program that emulates a computer terminal within some other display architecture.
ElectroNeek software is integrated with IBM Personal Communications terminal emulator which allows users to work with different midrange computers families including IBM AS/400 (iSeries).
How to get started?
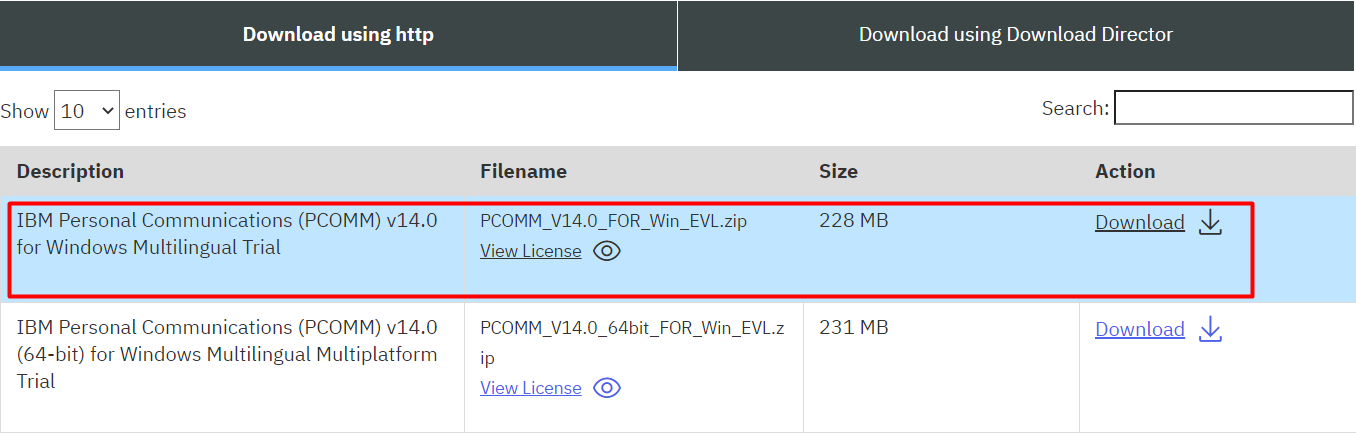
The first step is to download and install the terminal emulator. ElectroNeek software supports working with IBM Personal Communications emulator. To download the trial version, follow this link, sign up and fill in the short survey. The next opened page will show you two versions available to download. Make sure that you download IBM Personal Communications (PCOMM) v14.0 for Windows Multilingual Trial version. The 64-bit version is not supported by ElectroNeek at the moment.
What is next?
When the terminal is downloaded, install it on your computer. The installation process is simple - follow the instructions, do not change any default settings.
When the terminal is installed, launch it. At the end of this article you will find the attached file (nasa.ws). This file is used to connect to the server using a terminal emulator. Run this file with a double click.
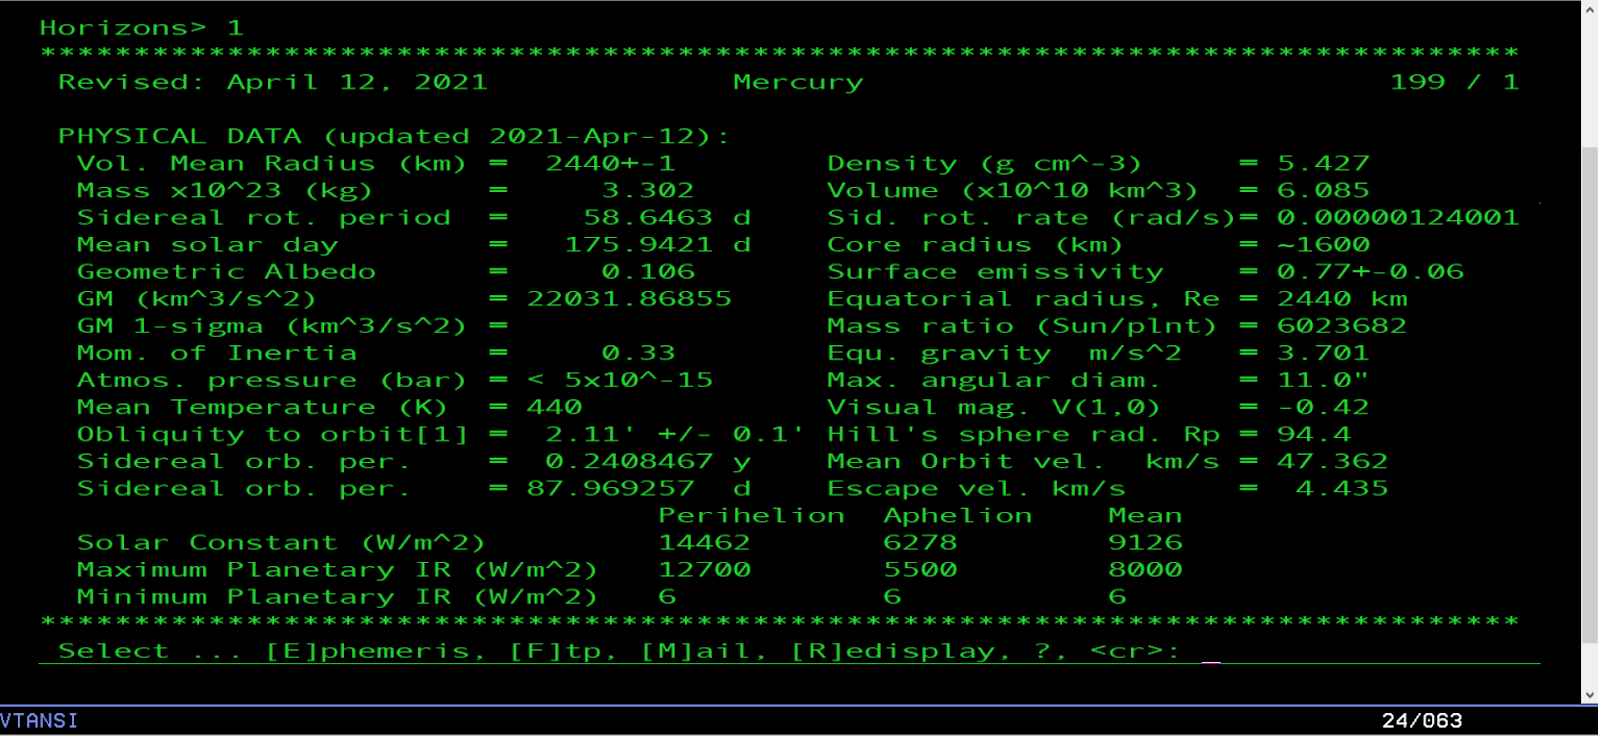
Now you can try interacting with this terminal: type “1” and press “Enter”. There you will see information about the planet Mercury.
Connecting to terminals in Studio Pro
ElectroNeek automatically connects to the IBM Personal Communications emulator as long as the emulator is running and connected to the server. The emulator must be running in a single instance.
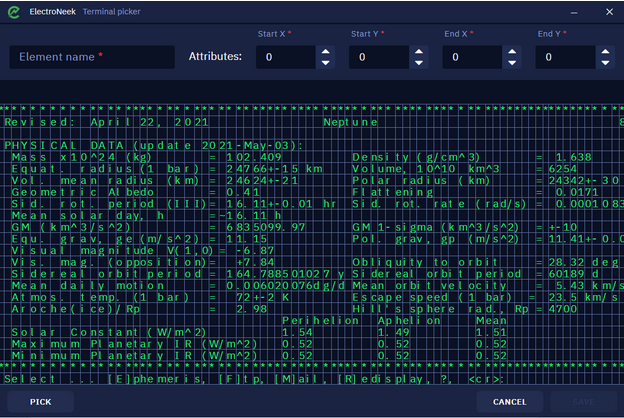
In this way, you can go straight to work with the actions from the “Terminal” section. Drag and drop any of them onto the canvas, such as "Input from keyboard". On the right side, you'll see a "Pick New Element" button, and clicking on it will open a special tool, Terminal Picker. This tool displays the same thing that the connected server displays in the emulator (without color rendering).
Specify the region on the Terminal Picker screen that you want to interact with. To do this, press the "Pick" button and adjust the X and Y coordinates to indicate the region you want. In addition to this method of setting coordinates, you can also press and hold the left mouse button and select the desired region on the terminal screen.
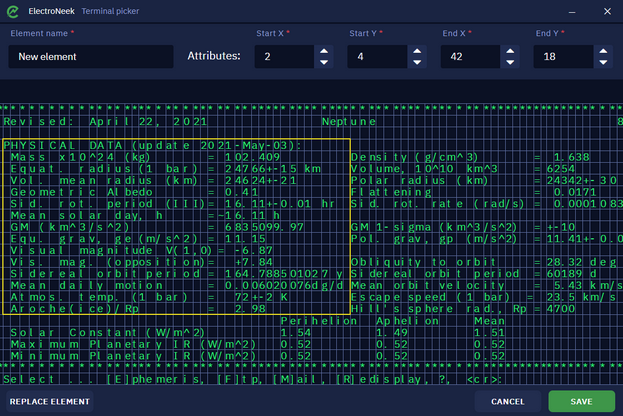
After that, you can then exit Terminal Picker and make sure that the bot is working correctly.
- Download nasa.ws.